POSTS
Diagrams with Dot
The Dot Language from graphviz provides an easy way to make diagrams.
After you install graphviz (e.g., with apt on LINUX or Chocolatey on Windows), you can define a graph in the dot language:
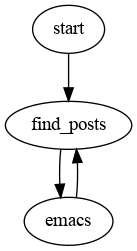
digraph G {
    start -> find_posts;
    find_posts -> emacs;
    emacs -> find_posts;
  }
and then run graphviz to render it using a command like
dot -Kdot -Tpng trivial-dot-demo.dot -o trivial-dot-demo.png
to take your data in trivial-dot-demo.dot and render it to
trivial-dot-demo.png.
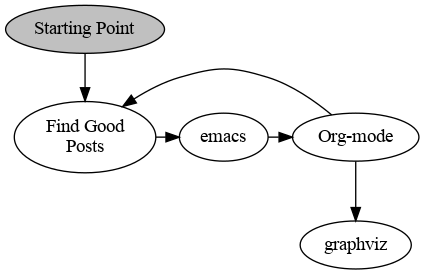
While it is easy to get started, you can also make more complex diagrams such as:
digraph G {
    start [label="Starting Point", style=filled, fillcolor=gray];
    find_posts [label="Find Good\nPosts"];
    emacs;
    orgmode [label="Org-mode"];
    graphviz;
    start -> find_posts;
    find_posts -> emacs;
    { rank = same;
    emacs -> orgmode;
    orgmode -> find_posts;
    }
    orgmode -> graphviz;
  }
and render them nicely as well:
If you prefer, you can replace png with jpg to produce JPEG files
(JPEG files take less space and some systems can view jpg files but
not png files). Another neat feature of org-babel and dot is that
you can simply execute an emacs lisp command of the form
(org-redisplay-inline-images)
and display the image inside emacs.
You can access dot and graphviz in many other ways such as in python, in R, in nodeJS, and many others.